
IPAC Transaction Count February 2022
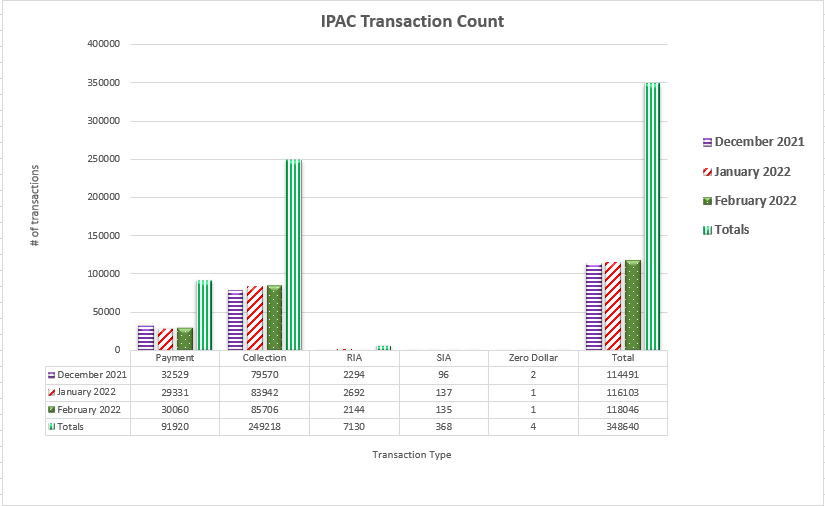
Table may scroll on smaller screens
| Date | Payment | Collection | RIA | SIA | Zero Dollar | Total |
|---|---|---|---|---|---|---|
| December 2021 | 32,529 | 79,570 | 2,294 | 96 | 2 | 114,491 |
| January 2022 | 29,331 | 83,942 | 2,692 | 137 | 1 | 116,103 |
| February 2022 | 30,060 | 85,706 | 2,144 | 135 | 1 | 118,046 |
| Totals | 94,920 | 249,218 | 7,130 | 368 | 4 | 348,640 |