
IPAC Transaction Count May 2024
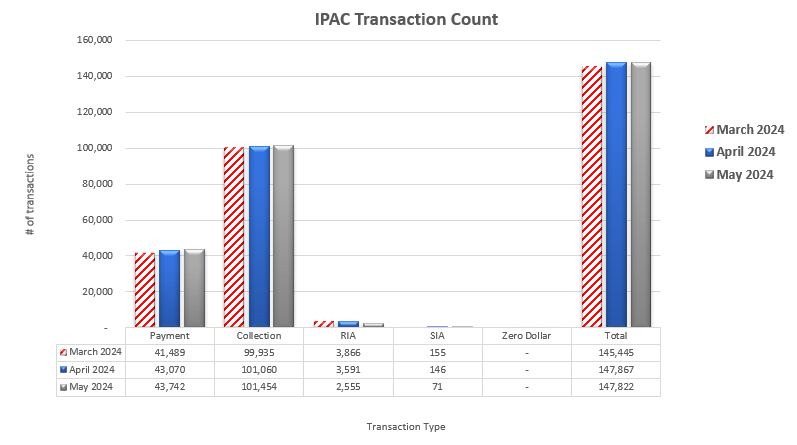
Table may scroll on smaller screens
| Date | Payment | Collection | RIA | SIA | Zero Dollar | Total |
|---|---|---|---|---|---|---|
| March 2024 | 41,489 | 99,935 | 3,866 | 155 | - | 145,445 |
| April 2024 | 43,070 | 101,060 | 3,591 | 146 | - | 147,867 | May 2024 | 43,742 | 101,454 | 2,555 | 71 | - | 147,822 |
| Totals | 84,559 | 200,995 | 7,457 | 301 | - | 293,312 |