
IPAC Transaction Count June 2023
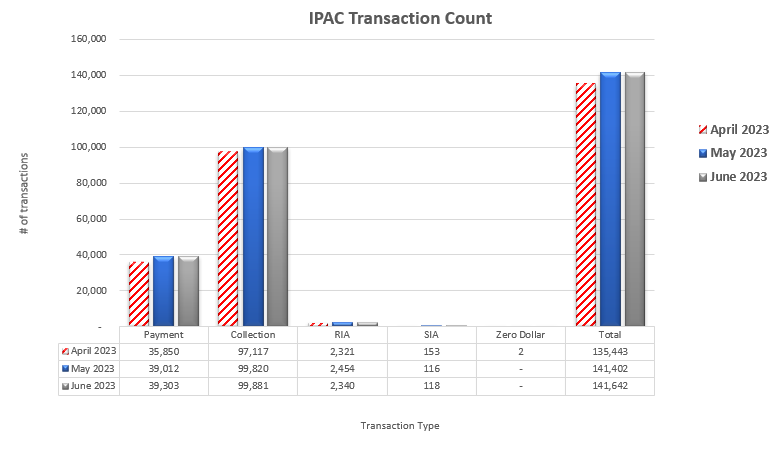
Table may scroll on smaller screens
| Date | Payment | Collection | RIA | SIA | Zero Dollar | Total |
|---|---|---|---|---|---|---|
| April 2023 | 35,850 | 97,117 | 2,321 | 153 | 2 | 135,443 |
| May 2023 | 39,012 | 99,820 | 2,454 | 116 | - | 141,402 |
| June 2023 | 39,303 | 99,881 | 2,340 | 118 | - | 141,642 |
| Totals | 114,165 | 296,818 | 7,115 | 387 | 2 | 418,487 |