
IPAC Transaction Count July 2024
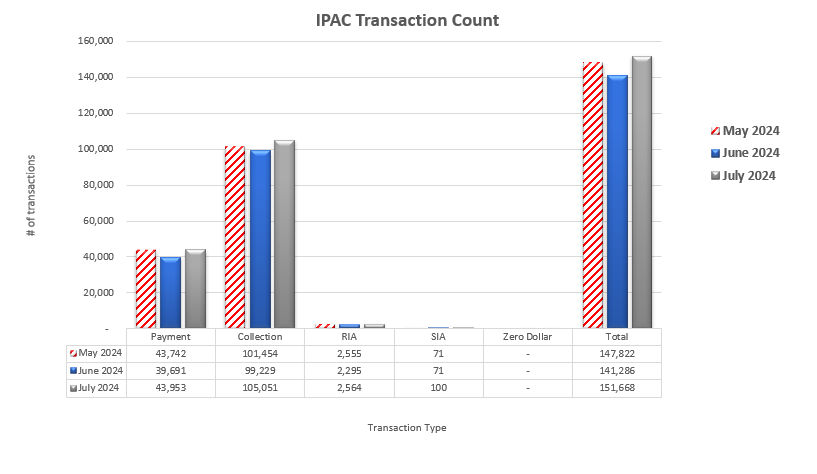
Table may scroll on smaller screens
| Date | Payment | Collection | RIA | SIA | Zero Dollar | Total |
|---|---|---|---|---|---|---|
| May 2024 | 43,742 | 101,454 | 2,555 | 71 | - | 147,822 |
| June 2024 | 39,691 | 99,229 | 2,295 | 71 | - | 141,286 |
| July 2024 | 43,953 | 105,051 | 2,564 | 100 | - | 151,668 |
| Totals | 127,386 | 305,734 | 7,414 | 242 | - | 440,776 |