
IPAC Transaction Count September 2020
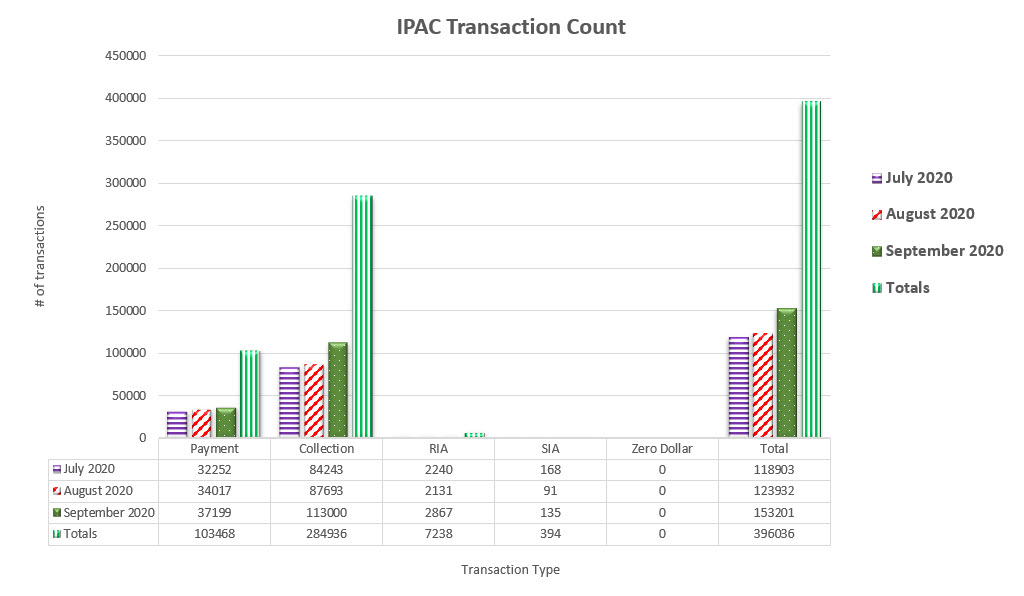
Table may scroll on smaller screens
| Date | Payment | Collection | RIA | SIA | Zero Dollar | Total |
|---|---|---|---|---|---|---|
| July 2020 | 32,252 | 84,243 | 2,240 | 168 | - | 118,903 |
| August 2020 | 34,017 | 87,693 | 2,131 | 91 | - | 123,932 |
| September 2020 | 37,199 | 113,000 | 2,867 | 135 | - | 153,201 |
| Totals | 103,468 | 284,936 | 7,238 | 394 | - | 396,036 |