
IPAC Transaction Count October 2020
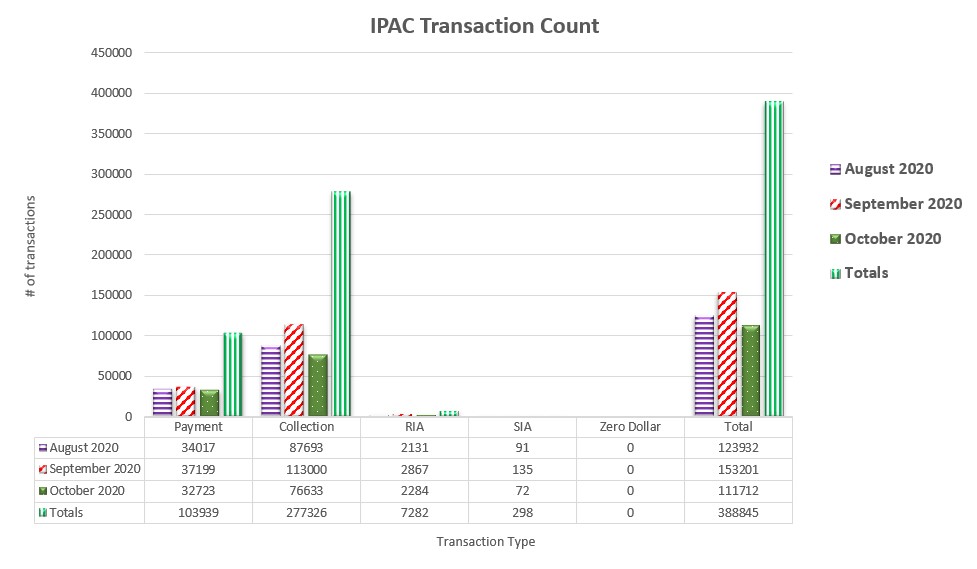
Table may scroll on smaller screens
| Date | Payment | Collection | RIA | SIA | Zero Dollar | Total |
|---|---|---|---|---|---|---|
| August 2020 | 34,017 | 87,693 | 2,131 | 91 | - | 123,932 |
| September 2020 | 37,199 | 113,000 | 2,867 | 135 | - | 153,201 |
| October 2020 | 32,723 | 76,633 | 2,284 | 72 | - | 111,712 |
| Totals | 103,939 | 277,326 | 7,282 | 298 | - | 388,845 |