
IPAC Transaction Count November 2020
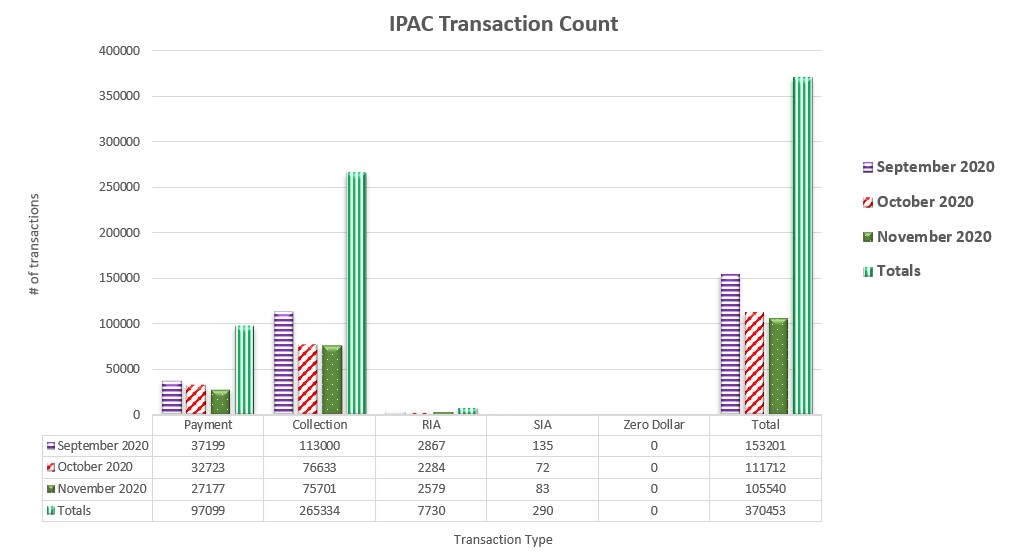
Table may scroll on smaller screens
| Date | Payment | Collection | RIA | SIA | Zero Dollar | Total |
|---|---|---|---|---|---|---|
| September 2020 | 37,199 | 113,000 | 2,867 | 135 | - | 153,201 |
| October 2020 | 32,723 | 76,633 | 2,284 | 72 | - | 111,712 |
| November 2020 | 27,177 | 75,701 | 2,579 | 83 | - | 105,540 |
| Totals | 97,099 | 265,334 | 7,730 | 290 | - | 370,453 |