
IPAC Transaction Count October 2017
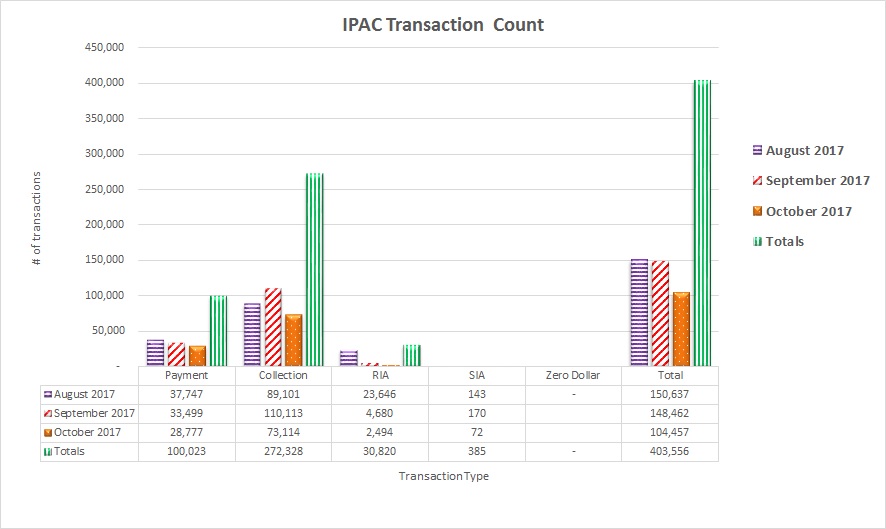
Table may scroll on smaller screens
| Date | Payment | Collection | RIA | SIA | Zero Dollar | Total |
| August 2017 | 37,747 | 89,101 | 23,646 | 143 | 0 | 150,637 |
| September 2017 | 33,499 | 110,113 | 4,680 | 170 | 148,462 | |
| October 2017 | 28,777 | 73,114 | 2,494 | 72 | 104,457 | |
| Totals | 100,023 | 272,328 | 30,820 | 385 | 0 | 403,556 |